Hardware profiler
The profiler times your prediction function and records its memory use, along with the hardware and software it ran on. It works the same way for frames, clips, image pairs and API calls.
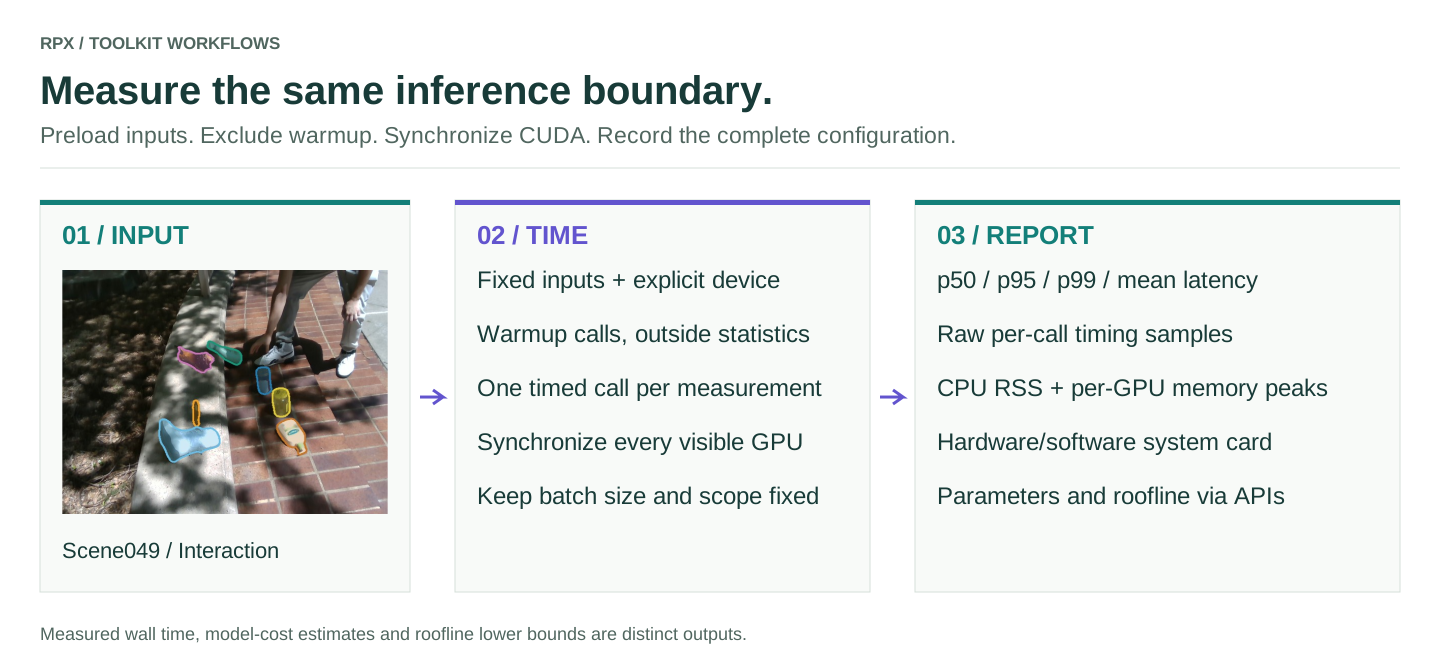
What it measures
| Layer | Tools | Meaning |
|---|---|---|
| Model cost | profile_model, ModelProfiler, EfficiencyMetadata |
Parameters, supported FLOP counts, estimated memory traffic and derived MACs |
| Hardware-parametric estimate | GPUSpec, RooflineBound |
Ideal compute/memory lower bounds, not measured inference time |
| Measured execution | LatencyProfiler, MemoryProfiler, SystemCard |
Wall-time percentiles, memory readings, and hardware/software context |
Anything that can't be measured is reported as unavailable, not zero. Timing an API, for example, says nothing about the remote GPU's memory or the model's size.
Try it on CPU
This profiles the packaged placeholder depth function, not a real model, so it needs no GPU or download. It checks that the profiler and its report work.
python - <<'PYINPUT'
import numpy as np
np.savez('profile-inputs.npz', rgb=np.full((480, 640, 3), 128, np.uint8))
PYINPUT
python -m rpx_benchmark.examples.profile_callable \
  --model rpx_benchmark.examples.benchmark_tasks:demo_depth \
  --inputs profile-inputs.npz --device cpu --precision fp32 \
  --unit frame --warmup 10 --repeats 1000 --output profile-demo.json
Profile your real model
Write my_model.py with a predict_depth(rgb) that loads the model once, puts it on the GPU, and includes whatever pre- and post-processing you want timed. Each key in the NPZ file becomes a keyword argument: use rgb_a and rgb_b for a pair model, and your function's own argument name for a clip model.
CUDA_VISIBLE_DEVICES=0 python -m rpx_benchmark.examples.profile_callable \
  --model my_model:predict_depth --inputs profile-inputs.npz \
  --device cuda --precision fp16 --unit frame \
  --warmup 10 --repeats 1000 --output results/my-model/profile.json
--precision is only recorded; it doesn't cast your model. Your function controls device placement, inference mode, generation limits and autocast. If you ask for CUDA and it isn't available, the profiler stops rather than falling back to CPU. It synchronizes every visible CUDA device before and after each call, so for a model that needs two GPUs, set CUDA_VISIBLE_DEVICES=0,1 and keep that setting for every comparison.
--repeats 1000 means 1,000 timed calls on the same input, not 1,000 different samples. Use representative inputs and time the same work for every model. Record the clip length or token budget as well as the image size, and keep other jobs off the GPUs while you measure.
Read the JSON
latency contains p50, p95, p99 and mean in milliseconds. latency_samples_ms preserves every measured call; warmup calls are excluded. inputs records each NPZ array's shape and dtype. system_card records the detected hardware/software and declared precision.
memory.cpu_process_lifetime_peak_mb is the process's peak resident memory, setup included, not the memory used by inference alone. The CUDA numbers are per-device PyTorch allocator peaks after warmup, weights included; they don't cover the whole board or allocations outside PyTorch. Profiling an API call from the CPU measures network and server time, while the memory figures are for your local client.
Use the profiler APIs in a runner
from rpx_benchmark.profiler import LatencyProfiler

latency = LatencyProfiler(warmup=0)
latency.add_sample_seconds(0.010)
latency.add_sample_seconds(0.020)
assert latency.percentiles()['p50_ms'] == 15.0
ModelProfiler prepares cost metadata and builds a ProfileReport from the measurements a runner collects. profile_model estimates the cost of a standalone PyTorch model. FLOP counts depend on the model and input; leave unknown values empty rather than zero.
For the paper's depth models, profile_depth_efficiency.py profiles each model on staged task manifests, and aggregate_depth_efficiency.py checks and combines the reports.